Welcome to DreamsPlus

SRE

Configuration Management for Reliable Systems

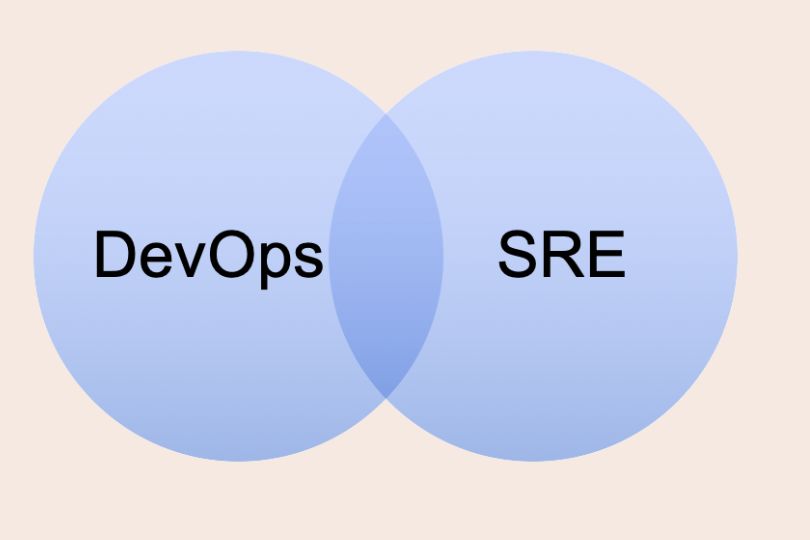
Configuration Management for Reliable Systems In today’s dynamic and fast-paced IT environment, ensuring the reliability of systems is critical. Whether you’re working in Site Reliability Engineering (SRE), DevOps, or IT operations, maintaining a reliable system means more than just monitoring uptime or scaling resources. Configuration Management (CM) is an essential practice that ensures your infrastructure and software systems are in a known and desired state, promoting consistency, automation, and reliability. In this blog, we’ll dive into the concept of Configuration Management and how it contributes to building reliable, scalable, and efficient systems. We will also explore the best practices and tools you can use to implement effective configuration management in your environment. What is Configuration Management? Configuration Management (CM) is the process of systematically managing, tracking, and automating the configurations of software, hardware, and networks across your infrastructure. It enables you to ensure that your systems and applications are consistent, secure, and functioning as intended. The goal of configuration management is to define the state of your infrastructure (e.g., server configurations, network settings, and application configurations) and automate the process of ensuring that systems always remain in that desired state. Key Benefits of Configuration Management: Consistency: CM ensures that environments are consistently configured, reducing the chances of errors and discrepancies. Scalability: As your infrastructure grows, CM enables the automated scaling of environments without manual intervention. Speed: CM automates configuration tasks, improving the speed of deployments and system provisioning. Security: By enforcing configuration standards, CM helps in maintaining secure configurations and applying security patches across systems. Importance of Configuration Management for Reliable Systems In an environment where downtime can result in lost revenue, decreased customer trust, or regulatory penalties, maintaining system reliability is paramount. Configuration management contributes significantly to ensuring that systems stay reliable by: 1. Automating System Configuration Manual configuration is error-prone and time-consuming, especially when dealing with large, complex systems. Configuration management automates the process of configuring and managing systems, reducing the risk of human error and increasing consistency across environments. With automation tools, you can: Ensure that servers are configured the same way every time. Automatically deploy updates or patches across hundreds or thousands of machines. Standardize configurations across different environments (e.g., development, staging, production). 2. Ensuring Stability and Predictability When systems are correctly configured, they behave in a predictable way. Misconfigurations can lead to system outages, performance issues, or security vulnerabilities. CM ensures that your systems are always in the desired state, preventing drift from the baseline configuration. For example, if a configuration file is changed manually on a server, configuration management tools will notice this and either alert you or automatically revert the change, thus maintaining stability. 3. Scaling and Replicating Environments As systems grow, the need to scale them effectively becomes crucial. CM helps with scaling environments by automating the provisioning of new resources, ensuring that they are configured identically to existing ones. This reduces the time and effort required to replicate environments and makes scaling simpler. For example, you can use configuration management to deploy new virtual machines (VMs) with the same configuration as existing ones, ensuring consistency across the entire system. 4. Faster Recovery and Incident Response In the event of a system failure or outage, configuration management can speed up recovery times. With a well-maintained configuration, you can quickly restore a system to a known good state. Configuration management tools often integrate with monitoring tools, so they can detect and remediate problems automatically. Best Practices for Configuration Management To ensure that configuration management contributes effectively to system reliability, it is essential to follow best practices. Below are some of the best practices that can help you optimize your configuration management process: 1. Use Version Control for Configuration Files One of the foundational practices of configuration management is versioning configuration files. Using version control systems (VCS) like Git to store your configuration files allows for tracking changes, rollback, and collaboration across teams. Benefits of version control: Track changes over time and collaborate with team members. Easily roll back to a previous, stable configuration. Document the reasons behind configuration changes for auditing purposes. 2. Automate Configuration with Tools The heart of configuration management is automation. Using configuration management tools (such as Ansible, Chef, Puppet, or SaltStack) can streamline the process of configuring systems. These tools automate tasks like installing software, applying patches, and managing network settings. Popular tools for automation: Ansible: A simple, agentless automation tool that uses YAML playbooks to define system configurations. Chef: An open-source tool that automates infrastructure configuration and management. Puppet: Automates infrastructure provisioning, including tasks such as server setup, package management, and file configurations. SaltStack: Offers powerful orchestration capabilities for managing configuration at scale. By using these tools, you can: Ensure that your configurations are consistent across all machines. Scale configurations quickly without manual intervention. Run checks and apply configurations automatically. 3. Implement Infrastructure as Code (IaC) Infrastructure as Code (IaC) refers to managing and provisioning infrastructure using code and automation instead of manual processes. This approach is crucial for maintaining reliable systems because it ensures that infrastructure is repeatable, versioned, and consistent. Tools like Terraform and CloudFormation allow you to define your infrastructure as code, enabling: Automated deployment of infrastructure. Consistent and repeatable environments. Faster scaling of infrastructure without manual effort. 4. Use Immutable Infrastructure In an immutable infrastructure model, servers and resources are never modified after deployment. Instead, if a change is required, a new instance is provisioned with the updated configuration. This approach ensures that systems remain in a known and stable state, reducing the chances of configuration drift. Advantages of immutable infrastructure: Reduces the risk of configuration drift over time. Simplifies the process of patching and updating systems. Enables more reliable rollback mechanisms. 5. Ensure Continuous Monitoring and Compliance Monitoring your infrastructure continuously is essential to maintaining reliable systems. Integrating monitoring with your configuration management system allows you to track deviations from the desired state and remediate them automatically. Additionally, you can track compliance with security policies and industry standards. Tools for continuous monitoring:

SRE

Continuous Integration and Deployment in Site Reliability Engineering (SRE)

Continuous Integration and Deployment in Site Reliability Engineering (SRE) In today’s fast-paced software development environment, reliability is paramount. Site Reliability Engineering (SRE) is a discipline that focuses on maintaining high system reliability while enabling rapid development. One of the key practices that help SRE teams achieve this balance is Continuous Integration (CI) and Continuous Deployment (CD). CI/CD practices play a crucial role in automating the process of code integration, testing, and deployment. They enable teams to deliver high-quality software quickly and consistently. In this blog, we will explore the significance of CI/CD in SRE, how they improve system reliability, and how to implement these practices effectively. What is Continuous Integration (CI) and Continuous Deployment (CD)? Continuous Integration (CI) Continuous Integration (CI) is the practice of frequently merging code changes into a central repository, followed by automated testing to ensure that the new code does not break the existing functionality. The goal is to catch issues early, enabling rapid identification and resolution of bugs. Key components of CI include: Version Control: Developers commit code changes to a version control system (e.g., Git) multiple times a day. Automated Testing: After every code commit, automated tests are run to ensure that the new changes don’t introduce defects. Build Automation: The code is automatically built to verify its correctness and functionality. Continuous Deployment (CD) Continuous Deployment (CD) extends CI by automatically deploying the code changes to production after they pass testing. This ensures that the software is always in a deployable state, allowing for faster and more reliable releases. Key components of CD include: Automated Deployments: Once the code passes automated tests, it is deployed to production without manual intervention. Canary Releases: CD often involves deploying updates to a small subset of users first to monitor for issues before a full-scale deployment. Rollback Mechanisms: If issues are detected after deployment, automatic rollback mechanisms ensure minimal disruption to users. Why CI/CD is Crucial for SRE CI/CD practices are vital in SRE because they address several challenges that can affect system reliability and software delivery. Let’s explore why they are indispensable in maintaining and improving system reliability. 1. Faster Delivery of High-Quality Software CI/CD allows for faster and more frequent releases. By automating testing and deployment, teams can deliver code changes quickly and efficiently. With faster release cycles, software can be deployed more regularly, ensuring that new features, bug fixes, and improvements reach users without delays. SREs benefit from CI/CD by ensuring that releases are continuous and stable, rather than risky and disruptive. 2. Automated Testing for Reliability One of the key components of CI is automated testing. By running tests on every code change, CI ensures that bugs and regressions are caught early. This is crucial in SRE, as it reduces the likelihood of introducing new issues into production that could affect system reliability. Automated tests in CI/CD ensure: Functional Testing: Validates that the new code performs the intended tasks. Regression Testing: Ensures that existing functionality continues to work after new changes. Performance Testing: Verifies that the system can handle the required load and performs optimally. 3. Minimizing Downtime and Disruptions CD helps reduce downtime by enabling more reliable and predictable releases. By automating the deployment process, the chances of human error are minimized, and code is deployed in small, manageable increments. This approach makes it easier to detect and resolve issues early in the process, reducing the risk of large-scale failures in production. With Canary Releases in CD, changes are first deployed to a small portion of users. This allows the team to monitor the impact and quickly identify potential issues before a full deployment. 4. Improved Collaboration Between Teams CI/CD fosters collaboration between development and operations teams—key to SRE practices. The development team focuses on writing code, while the operations team ensures that the system remains reliable. With CI/CD in place, both teams work more closely together, ensuring smooth deployments and quicker resolutions to issues. Additionally, CI/CD pipelines help establish a shared responsibility model. Developers are accountable for writing reliable code, while SREs are accountable for keeping the systems operational. This teamwork is crucial for building a reliable system that can scale efficiently. Implementing CI/CD in SRE While the benefits of CI/CD in SRE are clear, implementing these practices effectively requires careful planning and consideration. Here’s how you can implement CI/CD to improve system reliability. 1. Set Up Version Control and Code Repositories The first step to implementing CI/CD is establishing a version control system (VCS), such as Git, and a centralized code repository (e.g., GitHub, GitLab, Bitbucket). This enables developers to collaborate, track code changes, and maintain code integrity. 2. Automate Testing with a CI Tool Choose a Continuous Integration tool (e.g., Jenkins, CircleCI, Travis CI, GitLab CI) to automate the build and test process. Configure the tool to automatically run tests whenever a developer pushes code to the repository. Ensure that the tool supports different types of testing, including: Unit Tests: Validate individual components. Integration Tests: Check how different components interact with each other. End-to-End Tests: Simulate real user interactions and workflows. 3. Implement Automated Deployments with a CD Tool Once you have automated testing in place, the next step is to automate deployment. Use a Continuous Deployment tool (e.g., Spinnaker, Argo CD, AWS CodePipeline) to automatically deploy code to production once it passes testing. Integrate deployment strategies such as: Canary Releases: Roll out the deployment to a small user base first. Blue-Green Deployments: Deploy to a new environment (blue) and then switch traffic from the old environment (green) to the new one. Feature Toggles: Deploy code to production but control feature availability via feature flags. 4. Monitor and Rollback Continuous monitoring is essential to identify and respond to issues quickly. Set up monitoring tools (e.g., Prometheus, Datadog, New Relic) to track system performance, user interactions, and error rates. If issues arise after deployment, implement automated rollback mechanisms that quickly revert the system to the previous stable version, minimizing downtime and user disruption. 5. Ensure Security and Compliance Security and

SRE

The Importance of Postmortems in Site Reliability Engineering (SRE)

The Importance of Postmortems in Site Reliability Engineering (SRE) In the world of Site Reliability Engineering (SRE), reliability isn’t just a goal—it’s a critical requirement. Whether it’s uptime, performance, or user experience, ensuring systems run smoothly is a top priority. But even with the best practices in place, incidents are bound to happen. The key to improving reliability after an incident lies in how teams respond to failures. This is where postmortems come into play. Postmortems are an integral part of the SRE discipline, helping teams learn from failures and create more resilient systems. They provide an opportunity for teams to reflect, understand the root causes of incidents, and implement improvements that prevent future issues. In this blog, we’ll dive into the importance of postmortems in SRE, their key benefits, and how to conduct them effectively to ensure continuous improvement in your systems and processes. What Is a Postmortem? A postmortem is a structured review or analysis conducted after an incident or failure to understand what went wrong, why it happened, and how to prevent it from happening again. In SRE, postmortems are essential for improving system reliability, building trust, and ensuring that teams learn from mistakes. Postmortems are not about assigning blame. Instead, they focus on analyzing the failure and developing solutions to prevent it in the future. This “blameless” approach encourages openness, transparency, and a culture of continuous learning, all of which are crucial in SRE. Why Are Postmortems Crucial in SRE? 1. Fostering a Culture of Continuous Improvement The primary purpose of postmortems is to drive continuous improvement. Every incident provides valuable lessons, and postmortems allow teams to extract actionable insights from these events. By identifying the root causes of issues, teams can make data-driven decisions to enhance the system’s resilience, reducing the likelihood of similar problems in the future. 2. Encouraging Transparency and Accountability Postmortems foster transparency by openly discussing failures without fear of punishment or blame. This transparency builds trust within teams, helps identify systemic problems, and encourages engineers to own up to their actions and decisions. Additionally, accountability is reinforced in postmortems. While no one is blamed for incidents, the team collectively takes responsibility for fixing the underlying issues that caused the failure. 3. Preventing Recurrence of Incidents By analyzing the root causes of an incident, teams can identify patterns and take corrective actions to prevent similar issues from occurring again. Whether it’s improving monitoring, adjusting infrastructure, or enhancing processes, postmortems provide teams with the opportunity to put preventive measures in place. 4. Enhancing Collaboration Across Teams Postmortems often involve multiple teams—development, operations, product, and sometimes even customer support. By collaborating across teams during a postmortem, different perspectives are brought into the conversation, ensuring a comprehensive analysis and stronger solutions. This cross-functional collaboration also improves team dynamics and strengthens the organization’s ability to respond to future incidents effectively. 5. Improving Incident Response and Communication While postmortems are conducted after an incident, the process often leads to improvements in incident response itself. For example, postmortems may highlight gaps in the incident management process, such as delays in communication, unclear roles, or ineffective escalation procedures. By addressing these issues in postmortems, teams can streamline future incident responses, minimizing downtime and improving communication. Key Components of an Effective Postmortem To ensure that postmortems provide maximum value, it’s important to follow a structured approach. An effective postmortem typically includes the following key components: 1. Incident Overview The postmortem should start with a brief summary of the incident, including: What happened: Describe the incident and its impact. When it occurred: Include the timeline and duration of the issue. Who was affected: Identify customers, users, or systems impacted by the failure. 2. Root Cause Analysis A thorough root cause analysis is the core of a postmortem. This step involves digging into the technical and organizational factors that contributed to the incident. Key questions to explore include: What were the immediate triggers of the incident? Were there any warning signs that were missed? Did the incident result from a single failure or a series of interconnected issues? By identifying the root causes, teams can determine what changes need to be made to prevent similar issues in the future. 3. Impact Assessment Next, the postmortem should assess the impact of the incident. This includes understanding the scale of the problem, such as: How many users or customers were affected? What was the financial or reputational cost of the incident? Did the incident lead to downtime, degraded performance, or data loss? Understanding the full impact helps teams prioritize solutions and communicate effectively with stakeholders. 4. Actions Taken The postmortem should detail the actions that were taken during and after the incident. This includes: How quickly the team responded to the issue. What steps were taken to mitigate the impact. Any temporary fixes or workarounds that were applied. This section helps teams understand the effectiveness of their incident response process and identify areas for improvement. 5. Preventive Actions Finally, a key outcome of the postmortem is the preventive actions that will be taken to avoid similar incidents in the future. These may include: Enhancing monitoring and alerting to catch early signs of failure. Improving system architecture or infrastructure to handle scalability issues. Updating processes or training to avoid human errors. By documenting these actions, teams ensure that lessons are learned and applied to strengthen the system. Best Practices for Conducting Postmortems To make postmortems as effective as possible, follow these best practices: 1. Follow a Blameless Approach One of the most important aspects of postmortems is the blameless culture. Avoid blaming individuals or teams for the incident. Instead, focus on understanding how the system as a whole failed and what can be done to improve it. This encourages open, honest discussions and promotes a growth mindset. 2. Use a Standardized Template To ensure consistency and thoroughness, use a standardized template for your postmortems. This helps structure the discussion and ensures all necessary aspects are covered. Standardized postmortem templates may include sections like incident

SRE

DevOps vs. SRE: Key Differences Explained

DevOps vs. SRE: Key Differences Explained In today’s fast-paced software development environment, both DevOps and Site Reliability Engineering (SRE) have emerged as essential frameworks for driving efficiency, reliability, and scalability. While both aim to streamline operations and improve the quality of software delivery, their approaches, methodologies, and goals differ significantly. This blog will explore the key differences between DevOps and SRE, providing you with a clear understanding of both practices, their strengths, and how you can leverage them to enhance your organization’s IT infrastructure and software development lifecycle. What is DevOps? DevOps is a culture and set of practices that brings together software development (Dev) and IT operations (Ops) teams to collaborate throughout the entire software development lifecycle. The goal is to shorten the development cycle, increase deployment frequency, and deliver high-quality software faster. DevOps emphasizes: Collaboration: Breaking down silos between development, operations, and other teams. Automation: Automating repetitive tasks, such as code integration, testing, and deployment. Continuous Integration and Continuous Deployment (CI/CD): Enabling rapid, consistent, and automated releases. Key tools in the DevOps toolchain include: Jenkins GitLab Docker Kubernetes What is Site Reliability Engineering (SRE)? Site Reliability Engineering (SRE), originally developed by Google, is an engineering discipline that applies software engineering principles to IT operations with a focus on system reliability, scalability, and uptime. While it overlaps with DevOps in some areas, SRE introduces specific metrics and practices for measuring and ensuring reliability. SRE focuses on: Reliability: Ensuring systems are highly available and meet specified performance targets. Scalability: Building systems that can handle increasing loads without degradation. Service Level Objectives (SLOs): Defining measurable targets for system reliability. Incident Response and Post-Mortems: Focusing on reducing downtime and learning from failures. SRE teams typically use tools like: Prometheus Grafana PagerDuty Google Cloud Operations Suite Key Differences Between DevOps and SRE 1. Focus and Goals DevOps: The primary goal of DevOps is to shorten the development lifecycle and deliver software faster by promoting collaboration, automation, and CI/CD practices. SRE: SRE focuses on maintaining system reliability, uptime, and performance through the use of specific reliability metrics, such as SLOs, and engineering solutions to avoid downtime. Key Takeaways: DevOps is about improving the speed of delivery. SRE is focused on ensuring the reliability of systems while keeping them scalable. 2. Approach to Automation DevOps: DevOps emphasizes automating as much of the development pipeline as possible, including code integration, testing, deployment, and infrastructure provisioning. Automation in DevOps helps teams deploy software at high velocity with fewer errors. SRE: While automation is also important in SRE, it primarily focuses on automating tasks related to reliability, such as scaling infrastructure, recovery from failures, and incident management. Key Takeaways: DevOps automates the entire software delivery process. SRE automates to ensure system reliability and performance. 3. Reliability and Metrics DevOps: DevOps teams focus on continuous delivery and improving deployment speed, but they may not have specific mechanisms for measuring reliability. Performance is often considered as part of the overall delivery pipeline but is not the central focus. SRE: SRE teams place a heavy emphasis on reliability and performance through Service Level Objectives (SLOs), Service Level Indicators (SLIs), and Error Budgets. These metrics help teams quantify the reliability of their systems and make data-driven decisions on balancing feature development with reliability. Key Takeaways: DevOps is generally more focused on deployment speed. SRE defines and measures reliability through formal metrics like SLOs. 4. Incident Management and Post-Mortems DevOps: In DevOps, the focus on speed may sometimes come at the expense of proactive incident management. However, as the DevOps culture matures, many teams are beginning to incorporate best practices for incident response and post-mortem analysis. SRE: Incident management is central to the SRE practice. SREs establish detailed processes for responding to incidents quickly, minimizing downtime, and conducting blameless post-mortems to understand failures and prevent them in the future. Key Takeaways: DevOps teams may respond to incidents, but it is not as structured or formalized as in SRE. SRE teams use well-defined incident management processes and post-mortems to improve reliability over time. 5. Organizational Structure DevOps: DevOps teams are often cross-functional, with developers, operations, and QA personnel working together. The structure encourages collaboration and communication across different roles, often leading to faster deployment cycles. SRE: SRE teams are typically composed of software engineers who specialize in both development and operations, focusing on automating and maintaining system reliability. While they collaborate with other teams, their primary responsibility is ensuring systems are reliable and scalable. Key Takeaways: DevOps encourages broad collaboration between development and operations. SRE is typically a dedicated team of software engineers focused on reliability. 6. Cultural Differences DevOps: DevOps fosters a culture of collaboration and communication, breaking down silos between development, operations, and other teams. The goal is to enable faster and more efficient software delivery. SRE: While SRE shares some cultural aspects with DevOps, it has a more technical focus on ensuring system reliability through measurable objectives and engineering solutions. The emphasis is more on continuous improvement of systems than on collaboration. Key Takeaways: DevOps emphasizes collaboration to improve software delivery speed. SRE emphasizes engineering solutions to ensure long-term system reliability. When to Use DevOps vs. SRE? DevOps is a great choice for organizations that need to increase the speed of software delivery and are focused on automation and collaboration across all stages of the development lifecycle. If your primary concern is getting features to market faster, DevOps may be the right approach. SRE is ideal for organizations that have already achieved a certain level of speed in their software delivery and now need to focus on maintaining reliability at scale. If your goal is to minimize downtime and ensure high availability, implementing SRE practices can help achieve these goals. Conclusion: DevOps and SRE Can Work Together Although DevOps and SRE have different goals and methodologies, they can coexist within an organization. DevOps teams can focus on increasing deployment speed and fostering collaboration, while SRE teams can ensure that the systems remain reliable, scalable, and performant over time. By combining

SRE

Managing Distributed Systems in SRE: Best Practices for Scalability and Reliability

Managing Distributed Systems in SRE: Best Practices for Scalability and Reliability Managing distributed systems in today’s digital world can be a complex yet crucial task for organizations aiming to provide reliable and scalable services. With the increasing dependency on cloud computing, microservices, and multi-region deployments, ensuring the reliability of distributed systems is more critical than ever. That’s where Site Reliability Engineering (SRE) plays a pivotal role. In this blog, we’ll explore how SRE teams manage distributed systems by following best practices in system monitoring, scalability, automation, and incident management to ensure the systems’ reliability and performance. What is Site Reliability Engineering (SRE)? Site Reliability Engineering (SRE) is a discipline that incorporates aspects of software engineering and applies them to IT operations. It focuses on automating tasks to improve system reliability, scalability, and performance. SRE practices involve measuring reliability using Service Level Objectives (SLOs), implementing effective monitoring and alerting systems, and handling incidents efficiently to minimize downtime. SRE is particularly beneficial for managing distributed systems, where failure points are more common due to the complexity of various interconnected components. Challenges in Managing Distributed Systems Distributed systems are built using multiple components that work together over different machines, networks, or even data centers. While this architecture allows for better scalability and resilience, it also introduces several challenges: Latency: Communication between different components across networks can cause delays. Fault Tolerance: Systems need to handle partial failures without bringing down the entire service. Consistency: Ensuring that all components of the system reflect the same state. Monitoring and Visibility: With distributed systems, tracking performance and diagnosing issues can become complex. To successfully manage distributed systems, SREs use a combination of tools, processes, and best practices that address these challenges and optimize system reliability. Key Best Practices for Managing Distributed Systems in SRE 1. Define and Measure Service Level Objectives (SLOs) One of the cornerstones of SRE is the establishment of Service Level Objectives (SLOs). These are performance goals that define the acceptable level of reliability for a service or system. They are often based on key metrics like uptime, latency, and error rate. Actionable Tips for SLOs: Start Simple: Define SLOs for the most critical aspects of your system first, such as availability and response time. Monitor Real-Time Performance: Use tools like Prometheus or Datadog to continuously monitor your SLOs. Iterate and Improve: Review and adjust your SLOs based on user feedback and system performance trends. By measuring performance against these objectives, you can identify issues early and take proactive measures to prevent service outages. 2. Implement Distributed Tracing and Monitoring Monitoring the performance of a distributed system requires visibility into how requests flow through various components. Distributed tracing helps track requests as they travel through the system, making it easier to pinpoint latency bottlenecks and identify failing components. Common distributed tracing tools include: Jaeger Zipkin OpenTelemetry Additionally, metrics-based monitoring is essential for tracking system health and performance in real time. Tools like Prometheus, Grafana, and Datadog provide insights into system behavior, allowing teams to observe service health, set alerts, and trigger automatic responses when critical thresholds are reached. Actionable Tips for Effective Monitoring: Integrate Tracing with Metrics: Link distributed tracing with your metrics to get a comprehensive view of system health. Establish Alerting Protocols: Set up automated alerts when SLOs are breached, indicating potential issues in the distributed system. Centralize Logs: Use log aggregation tools like ELK Stack (Elasticsearch, Logstash, Kibana) or Splunk to collect and analyze logs from all system components. 3. Implement Fault Tolerance and Resiliency Fault tolerance is a critical aspect of distributed systems. A well-designed distributed system should be able to tolerate failures in individual components without affecting the overall service. Some best practices for building resilient distributed systems include: Redundancy: Ensure that critical components are duplicated to provide failover mechanisms in case one fails. Graceful Degradation: Design your system to degrade gracefully by reducing functionality instead of failing completely when errors occur. Circuit Breakers: Use circuit breakers to stop the propagation of failures across the system. For example, if one service is failing, a circuit breaker will prevent it from affecting other services. Actionable Tips for Fault Tolerance: Automate Failover: Automate the failover process to minimize downtime when components fail. Test Resiliency: Regularly perform chaos engineering to simulate failures and test how well your system recovers. Monitor Latency: Track the latency between distributed components to identify slowdowns that may indicate potential failure points. 4. Automate Incident Response and Resolution In a distributed system, incidents are inevitable. However, the key to minimizing their impact is swift and automated responses. An incident management strategy should incorporate the following: Alerting: Set up comprehensive alerting systems that notify the appropriate teams when an incident occurs. Use tools like PagerDuty or Opsgenie for incident escalation. Runbooks: Create standardized runbooks to provide clear, step-by-step instructions on how to resolve common issues. Post-Mortem Analysis: After an incident, conduct a post-mortem analysis to understand what went wrong, identify gaps in your system, and implement improvements. Actionable Tips for Incident Management: Automate Recovery Processes: Implement self-healing mechanisms that can automatically recover from failures without human intervention. Simulate Incidents: Use tools like Gremlin or Chaos Monkey to simulate failures and test how well your team responds. Conduct Blameless Post-Mortems: Focus on the root cause of incidents rather than assigning blame. This encourages learning and continuous improvement. 5. Scaling Distributed Systems Efficiently Scaling distributed systems requires both horizontal and vertical scaling strategies to ensure optimal performance and reliability as demand increases. Horizontal scaling involves adding more instances of services, while vertical scaling involves upgrading the resources of existing instances. Actionable Tips for Scaling: Auto-Scaling: Use cloud services like AWS Auto Scaling or Kubernetes to automatically adjust the number of service instances based on real-time traffic. Load Balancing: Implement load balancing mechanisms to distribute traffic evenly across instances and avoid overloading any single component. Capacity Planning: Regularly conduct capacity planning exercises to forecast growth and prepare the system for future demands. Key Tools and Technologies for Managing Distributed Systems Managing

SRE

Service Level Objectives: How to Define Effective SLOs

Service Level Objectives: How to Define Effective SLOs In today’s competitive digital landscape, businesses rely on high-performing, available, and reliable systems to provide an optimal customer experience. However, maintaining system reliability and meeting user expectations is a delicate balancing act. This is where Service Level Objectives (SLOs) come into play. By defining clear and measurable goals for service performance, SLOs help organizations focus on the most important aspects of reliability. In this blog, we’ll explore what SLOs are, why they are crucial, and provide actionable steps to define effective SLOs that align with both business needs and customer expectations. What Are Service Level Objectives (SLOs)? Service Level Objectives are specific, measurable targets that define the acceptable level of service performance for a given system, product, or service. These objectives serve as benchmarks for the reliability of your service and help teams focus on what matters most: customer satisfaction and system uptime. SLO vs. SLA vs. SLI Before we dive deeper into how to define SLOs, it’s essential to understand how they differ from Service Level Agreements (SLAs) and Service Level Indicators (SLIs): SLA (Service Level Agreement): A formal contract between a service provider and a customer, outlining the expected level of service (e.g., uptime, response time). SLAs are legally binding. SLI (Service Level Indicator): A specific metric used to measure the reliability of a service (e.g., availability, latency). SLO (Service Level Objective): A target or goal set for a particular SLI, which helps ensure the service meets the expectations outlined in the SLA. In simpler terms, SLIs measure performance, SLOs define performance goals, and SLAs formalize the agreement with customers. Why Are SLOs Important? 1. Alignment with Business Goals SLOs help align your team’s efforts with the broader business objectives. By focusing on key service metrics, organizations can prioritize improvements that have the most significant impact on customer satisfaction. Actionable Tip: Collaborate with product managers and business stakeholders to identify customer-facing metrics that align with business goals. This could include metrics like page load time, transaction success rate, or availability. 2. Improved Reliability and Customer Experience By setting clear reliability goals, SLOs enable teams to proactively maintain service quality. When these objectives are met, customers experience fewer disruptions, leading to improved trust and retention. Actionable Tip: Use historical data to inform realistic SLO targets. For instance, if your app typically experiences 99.5% uptime, aim for an SLO of 99.9% with incremental improvements over time. 3. Effective Resource Allocation SLOs help teams prioritize work by identifying areas that require attention. Rather than fixing every issue, teams can focus on the most critical areas that affect service quality and customer satisfaction. Actionable Tip: Implement automated alerting based on SLO breaches. This helps teams quickly identify when services are out of compliance and allows for timely intervention. 4. Continuous Improvement With clearly defined SLOs, teams can track progress over time, identify trends, and make data-driven decisions. SLOs facilitate a culture of continuous improvement by emphasizing measurable, incremental progress. Actionable Tip: Review SLO performance quarterly to adjust goals based on changing customer expectations or business priorities. Steps to Define Effective SLOs Defining meaningful and actionable SLOs requires careful planning, input from stakeholders, and an understanding of the service’s purpose. Below are the steps to define SLOs effectively: 1. Identify Key Service Metrics (SLIs) The first step in defining SLOs is identifying which Service Level Indicators (SLIs) will be used to measure service performance. SLIs represent the most important metrics that impact customer satisfaction. Common SLIs include: Availability: Percentage of time the service is available. Latency: Time it takes to respond to a user request. Error Rate: Percentage of requests that result in an error. Throughput: Number of requests processed per unit of time. Capacity: Maximum workload that the system can handle without degrading performance. 2. Set Realistic and Achievable Targets Once the key SLIs are identified, the next step is to define realistic and achievable targets for each. This requires analyzing historical data to understand what level of performance is typical and feasible. Tips for setting realistic targets: Consider user expectations: For example, a latency SLO of under 200 milliseconds might be acceptable for web apps but could be too high for mobile apps. Account for system constraints: SLOs should reflect the system’s current capabilities, with room for future improvement. Start with incremental improvements: If your system has 99% uptime, aim for a target of 99.5% or 99.9% in the short term. 3. Define the SLO Scope and Time Window Each SLO needs to be tied to a specific scope and time window. These parameters define the frequency and extent of measurements: Scope: What part of the service does the SLO apply to? Is it for the entire service, specific regions, or certain features? Time Window: Over what period will the SLO be measured? Common time windows include daily, weekly, or monthly. For example, an availability SLO might be defined as “99.9% uptime over a 30-day period.” 4. Communicate SLOs Across Teams Effective communication is key to ensuring that everyone within the organization understands the importance of SLOs and how they affect overall service reliability. Actionable Tip: Regularly update internal stakeholders, including product managers, engineering teams, and customer support, on SLO performance. 5. Monitor, Measure, and Iterate Once SLOs are defined, monitoring and measurement tools (such as Prometheus, Grafana, or Datadog) should be set up to track performance. Regular monitoring helps identify when services breach the agreed-upon SLOs and triggers corrective actions. Actionable Tip: Use automated alerts to notify teams of SLO breaches in real-time, enabling quick responses to minimize customer impact. Actionable Tip: Iterate and refine SLOs based on performance feedback and evolving business requirements. Best Practices for Defining and Managing SLOs 1. Make SLOs Customer-Centric SLOs should be tied to metrics that directly impact user experience. Customer-facing SLIs such as availability, latency, and error rate should be prioritized to ensure that your SLOs align with customer expectations. 2. Start Small, Scale Over Time It’s tempting to define multiple SLOs for every

SRE

Site Reliability Analytics and Reporting: Unlocking the Power of Data for System Reliability

Site Reliability Analytics and Reporting: Unlocking the Power of Data for System Reliability In today’s fast-paced digital world, businesses rely on complex systems to deliver services, applications, and products. Any downtime, performance issues, or inefficiencies can lead to customer dissatisfaction and financial loss. Site Reliability Engineering (SRE) aims to address these challenges by ensuring that systems are reliable, scalable, and high-performing. One of the key pillars of SRE is site reliability analytics and reporting, which helps teams monitor, analyze, and optimize their systems effectively. This blog will explore the importance of site reliability analytics, best practices for collecting and interpreting data, and how to use this data for continuous improvement in your operations. What is Site Reliability Analytics? Understanding the Role of Analytics in Site Reliability Site reliability analytics refers to the practice of collecting, processing, and analyzing data from different system components to measure and improve the reliability, availability, and performance of services. This data-driven approach provides insights into system behavior, helping teams quickly identify potential issues and take corrective actions before they impact users. Key areas where analytics play a crucial role in site reliability include: Uptime and Availability: Monitoring how often systems are up and available. Latency and Performance: Tracking how quickly services respond to requests. Incident Management: Identifying, managing, and resolving issues effectively. Capacity Planning: Predicting system load and ensuring resources are sufficient. Importance of Site Reliability Analytics and Reporting 1. Improved Decision-Making Analytics provide teams with real-time data, enabling better-informed decisions. By monitoring system metrics such as response times, error rates, and resource usage, teams can identify areas for improvement and prioritize tasks effectively. Actionable Tip: Use real-time dashboards to display key metrics. Tools like Grafana or Kibana allow you to create custom visualizations for data-driven decision-making. 2. Proactive Problem Resolution Rather than waiting for issues to escalate into major incidents, site reliability analytics help teams identify potential problems early. Monitoring metrics like error rates and CPU usage can alert teams to abnormal behaviors before they affect users. Actionable Tip: Set up alerting thresholds based on historical data trends. For example, if CPU usage consistently exceeds 75% for an extended period, an alert should trigger. 3. Faster Incident Response Incident response is a critical part of site reliability, and having the right analytics can drastically improve response times. By leveraging analytics, teams can understand the root cause of incidents quickly, allowing them to resolve issues faster. Actionable Tip: Integrate incident management tools with your monitoring system. This will help create automated workflows for incident response, reducing human intervention and speeding up resolution times. 4. Continuous Improvement By collecting data over time, site reliability analytics provide historical insights that allow teams to track the effectiveness of improvements. This data can be used to refine processes and prevent future issues. Actionable Tip: Conduct post-mortems for all major incidents. Analyze the metrics leading up to and during the incident to understand what went wrong and how it can be avoided in the future. Key Metrics for Site Reliability Analytics 1. Service-Level Indicators (SLIs) SLIs are metrics that define the reliability of a service. These indicators are typically related to user experience, such as: Availability: The percentage of time the service is accessible and functional. Latency: The time it takes to process a request from the user. Error Rate: The percentage of requests that result in errors. 2. Service-Level Objectives (SLOs) SLOs define the target values for SLIs. For instance, an SLO for latency might be to ensure that 95% of requests are completed within 200 milliseconds. Setting clear SLOs helps teams focus on critical metrics that directly affect user experience. Actionable Tip: Regularly review and adjust SLOs based on user feedback and changing business requirements. 3. Service-Level Agreements (SLAs) SLAs are formal agreements between service providers and customers that define the expected level of service, including uptime, response time, and support. While SLOs are internal metrics, SLAs are often external commitments that businesses must uphold. 4. Mean Time to Recovery (MTTR) MTTR measures how quickly a system can recover from an incident or failure. A lower MTTR indicates that issues are being resolved swiftly, minimizing downtime and impact on users. Actionable Tip: Implement runbooks and automated remediation workflows to decrease MTTR and enhance recovery speed. Tools for Site Reliability Analytics and Reporting 1. Prometheus Prometheus is an open-source monitoring system that is widely used for collecting metrics and generating alerts. It integrates well with cloud-native applications and services, making it ideal for modern DevOps environments. Key Features: Multi-dimensional data model Powerful query language (PromQL) Scalability and reliability for large-scale systems 2. Grafana Grafana is a popular open-source platform for data visualization. It integrates seamlessly with Prometheus and other monitoring tools to create real-time dashboards that display system metrics. Key Features: Customizable and interactive dashboards Alerts and notifications Integration with multiple data sources (e.g., Prometheus, Elasticsearch) 3. Datadog Datadog is a comprehensive monitoring and analytics platform that provides a unified view of applications, infrastructure, and logs. It offers real-time metrics, dashboards, and advanced analytics to improve site reliability. Key Features: Cloud-native monitoring AI-powered anomaly detection End-to-end tracing for application performance monitoring (APM) 4. New Relic New Relic is an APM solution that helps organizations track application performance and system health. It offers deep insights into backend systems, user interactions, and real-time performance metrics. Key Features: Real-time monitoring of applications and infrastructure Full-stack observability Alerting and anomaly detection Best Practices for Effective Analytics and Reporting 1. Establish Clear Metrics and Objectives Before diving into analytics, it’s essential to define the key metrics that reflect the reliability of your systems. Work with stakeholders to establish SLIs, SLOs, and SLAs that align with business goals. Actionable Tip: Collaborate with product managers and operations teams to define business-critical metrics, and ensure that they align with customer expectations. 2. Automate Reporting and Alerting Manual reporting can be slow and error-prone. Leverage automation to generate reports and alerts based on predefined thresholds and performance indicators. This will allow your team to respond to issues

SRE

Automating Operations with Infrastructure as Code (IaC)

Automating Operations with Infrastructure as Code (IaC) In the modern age of cloud computing, IT operations must keep pace with the fast-evolving needs of businesses. Infrastructure as Code (IaC) has emerged as a game-changing practice for automating the management and provisioning of IT infrastructure. By treating infrastructure configurations as code, organizations can achieve higher levels of consistency, speed, and scalability in their operations. This blog will dive into the importance of IaC in automating operations, key tools and best practices, and how to successfully implement IaC in your organization to drive efficiency and reliability. What is Infrastructure as Code (IaC)? Definition and Key Concepts Infrastructure as Code (IaC) refers to the practice of managing and provisioning infrastructure through machine-readable definition files, rather than through physical hardware or manual processes. With IaC, infrastructure is defined in a version-controlled codebase, allowing it to be easily deployed, updated, and maintained. The goal of IaC is to automate infrastructure management tasks such as provisioning servers, setting up networks, and configuring software environments, making the process repeatable, consistent, and less error-prone. Benefits of IaC for Automation Consistency and Repeatability: IaC ensures that infrastructure setups are the same across different environments, reducing configuration drift. Speed: Automation with IaC speeds up the deployment of infrastructure, enabling faster product delivery. Cost-Effectiveness: By automating tasks, IaC minimizes human intervention, reduces errors, and optimizes resource utilization. Scalability: IaC allows easy scaling of infrastructure by automatically provisioning and de-provisioning resources. How IaC Drives Automation in IT Operations 1. Provisioning and Deployment One of the most significant use cases for IaC is in infrastructure provisioning and deployment. Through simple scripts or templates, IaC tools can automate the provisioning of cloud resources like virtual machines, storage, and networking. This eliminates the manual, time-consuming work involved in deploying environments. Actionable Tip: Adopt Terraform or AWS CloudFormation for defining infrastructure using declarative code. With these tools, you can specify the desired state of your infrastructure and let the tool manage the creation, modification, and destruction of resources. 2. Consistency Across Environments IaC helps ensure consistency across development, staging, and production environments. By codifying infrastructure configurations, teams can replicate environments with precision, ensuring no discrepancies between them. Actionable Tip: Version control your infrastructure configurations with tools like Git. This allows you to track changes and roll back to previous versions when necessary, maintaining consistent environments across the pipeline. 3. Continuous Integration and Continuous Deployment (CI/CD) IaC plays a vital role in automating the CI/CD pipeline. It integrates seamlessly with automation tools to continuously deploy infrastructure changes alongside application code changes. Actionable Tip: Integrate Jenkins or GitLab CI with IaC to trigger automated deployments whenever code changes are made. This ensures that infrastructure updates are always in sync with software development. 4. Automated Configuration Management Using IaC, you can automate the configuration of systems—installing software, setting configurations, and enforcing security policies—all without manual intervention. Actionable Tip: Leverage tools like Ansible, Puppet, or Chef to automate configuration management tasks. These tools allow you to maintain the configuration of servers and other systems, ensuring they remain consistent and secure. Popular IaC Tools for Automation 1. Terraform Terraform is a widely adopted IaC tool for provisioning and managing infrastructure across multiple cloud providers, including AWS, Azure, and Google Cloud. Its declarative syntax and robust ecosystem of providers make it ideal for managing infrastructure in a cloud-native environment. Key Features: Multi-cloud support Version control integration Change automation with a clear execution plan Modular configurations for reusability 2. AWS CloudFormation AWS CloudFormation is a service specifically designed for automating the deployment of AWS resources. It allows users to define cloud resources as code, making it easier to manage complex AWS environments. Key Features: Native integration with AWS services Infrastructure templates in YAML or JSON Automated rollback on failure 3. Ansible Ansible is a powerful configuration management tool that automates software provisioning, configuration management, and application deployment. Unlike Terraform and CloudFormation, Ansible is procedural, meaning users specify how the system should be configured. Key Features: Agentless (no need to install agents on target systems) Simple YAML syntax Seamless integration with existing infrastructure 4. Chef and Puppet Both Chef and Puppet are popular IaC tools for configuration management. They allow users to automate repetitive infrastructure tasks and maintain system consistency. Key Features: Chef: Focuses on automating infrastructure with code written in Ruby. Puppet: Uses declarative language to define system configurations. Best Practices for Implementing IaC 1. Start with a Clear Infrastructure Blueprint Before automating with IaC, define your infrastructure blueprint. Identify all the components you need to automate, such as virtual machines, databases, networks, and storage, and how they interact. Having a clear understanding will guide the implementation of IaC and prevent issues in the long run. Actionable Tip: Use tools like Lucidchart or Draw.io to visualize your infrastructure architecture before starting with IaC implementation. 2. Version Control Your Infrastructure Code Just like application code, IaC should be version-controlled. This allows for easier collaboration, better traceability, and the ability to roll back to a stable version if issues arise. Actionable Tip: Set up a dedicated Git repository for your IaC scripts and infrastructure configuration files. Ensure your team follows a Git branching strategy for smooth collaboration. 3. Automate Testing and Validation IaC code should be thoroughly tested before deployment. Implement unit tests, integration tests, and security scans to catch errors early in the process. Actionable Tip: Use tools like Kitchen-Terraform to run integration tests for your Terraform code or Ansible Lint for Ansible playbooks. 4. Implement Continuous Monitoring Once your infrastructure is automated, continuous monitoring becomes crucial. Use tools like Prometheus, Datadog, or CloudWatch to keep track of system health and performance. Actionable Tip: Set up monitoring for key infrastructure components such as server uptime, storage usage, and network latency. Define alerts for any anomalies, ensuring that you can take corrective action before downtime occurs. 5. Ensure Security with Role-Based Access Control (RBAC) IaC involves automating sensitive configurations, so security is paramount. Implement Role-Based Access Control (RBAC) to control who can modify and

SRE

Using Error Budgets to Drive Reliability: A Pathway to Resilient Systems

Using Error Budgets to Drive Reliability: A Pathway to Resilient Systems In today’s fast-paced digital world, reliability is non-negotiable. Whether it’s ensuring uptime for mission-critical services or optimizing user experiences, businesses are increasingly turning to error budgets as a key component in maintaining and improving system reliability. This concept is rooted in the principles of Site Reliability Engineering (SRE), offering a quantifiable way to balance system uptime with the need for innovation and development. In this blog, we will explore how error budgets work, their importance in driving reliability, and best practices for utilizing them effectively. What is an Error Budget? Definition and Concept An error budget is the allowable threshold of errors or downtime within a specified period, often expressed as a percentage. It is the difference between a service’s Service Level Objective (SLO)—the target reliability level—and its actual performance. For example, if a service’s SLO is 99.9% uptime, the error budget is 0.1%. This means that the service can afford 0.1% of downtime or errors within a defined period (typically a month or a quarter). The goal is not to minimize errors completely, but to manage them within the acceptable threshold. The Importance of Error Budgets Error budgets allow teams to strike a balance between innovation and reliability. They ensure that reliability goals are maintained while still providing room for experimentation and system changes. This creates a structured approach to decision-making, enabling teams to prioritize engineering efforts based on data-driven insights rather than just gut feel or external pressures. How Error Budgets Drive Reliability 1. Balancing Stability with Innovation Error budgets encourage a proactive approach to balancing the need for stability and the desire for innovation. While reliability is critical, constantly focusing on reducing downtime can stifle innovation. An error budget provides a safety net for teams to experiment and deploy new features without the fear of causing disruptions. Actionable Tip: If you are close to exhausting your error budget, prioritize reliability fixes over feature development. On the other hand, if your error budget is underutilized, you can focus more on deploying new features or experimenting with new technologies. 2. Data-Driven Decision Making Error budgets provide measurable and clear data, helping teams make informed decisions. When reliability drops below a certain threshold, an error budget triggers a series of actions to improve the system’s health, such as pausing deployments or improving the infrastructure. Actionable Tip: Use monitoring tools like Datadog or Prometheus to track and visualize your error budget. This helps you quickly spot issues before they become critical and adjust your strategy accordingly. 3. Ownership and Accountability Having error budgets in place means that teams, such as development and operations, share ownership of the system’s reliability. Both teams are responsible for maintaining the error budget by implementing robust testing, monitoring, and incident response strategies. Actionable Tip: Foster a culture of collaboration between development and operations teams. Set up joint reviews of system performance and error budget usage to ensure that everyone is aligned on the goals. Best Practices for Using Error Budgets 1. Set Clear Service Level Objectives (SLOs) Before an error budget can be useful, you must establish clear and achievable Service Level Objectives (SLOs). These are the measurable targets you expect your system to meet in terms of uptime, latency, error rates, and throughput. SLOs should be based on customer expectations, business needs, and technical constraints. Actionable Tip: Review historical performance data to set realistic SLOs. For example, if your system is consistently at 99.95% uptime, setting an SLO of 99.9% ensures that you maintain a buffer and avoid unnecessary pressure. 2. Track Error Budgets Continuously To effectively manage error budgets, it’s essential to track performance in real-time. You need up-to-date data on service health, which can be monitored through logs, metrics, and alerts. By continuously tracking error budgets, you can take corrective actions before the situation escalates. Actionable Tip: Use automated alerting systems to notify you when your service is nearing the edge of its error budget. Tools like New Relic, Grafana, or Prometheus can help automate error budget monitoring and create custom dashboards to visualize SLO performance. 3. Collaborate Across Teams Error budgets help bridge the gap between developers, operations, and business stakeholders. When a service is running close to exceeding its error budget, all teams need to be aligned and aware of the situation. Having cross-functional collaboration ensures that the right actions are taken to address issues swiftly. Actionable Tip: Schedule regular meetings to review system performance, discuss error budget consumption, and adjust priorities accordingly. Use tools like Slack or Microsoft Teams to ensure smooth communication across teams. 4. Respond to Errors Proactively An error budget is not just a tool for setting goals—it’s a mechanism for triggering action when things go wrong. When your error budget is at risk, it’s time to pause new features or releases and focus on addressing the issues. The longer you wait, the higher the risk of negatively impacting user experience. Actionable Tip: Implement an incident response playbook to help your team act quickly when the error budget is at risk. Define clear escalation paths and response actions to minimize downtime and fix reliability issues. 5. Use Error Budgets to Prioritize Engineering Efforts Error budgets should directly influence the prioritization of work within your teams. If your service is consistently meeting its SLOs and leaving plenty of error budget unused, it’s a sign that the system is healthy enough to allow for more ambitious work, such as adding new features or improving other aspects of the infrastructure. Conversely, if the error budget is running low, the focus should shift towards enhancing reliability. Actionable Tip: Adjust your sprint planning based on the state of your error budget. For example, if the error budget is exhausted, shift your focus to stability improvements during the next sprint. 6. Postmortems and Continuous Improvement When an error budget is consumed, it’s vital to conduct postmortems to understand the root causes and prevent future occurrences. Postmortems help identify whether the issue

SRE

Capacity Planning and Load Testing Techniques: Ensuring System Efficiency

Capacity Planning and Load Testing Techniques: Ensuring System Efficiency In today’s fast-paced digital environment, organizations need to ensure their systems are scalable and can handle fluctuating traffic volumes. Capacity planning and load testing are two critical practices that allow businesses to anticipate system demands, avoid downtime, and deliver a seamless user experience. This blog will cover the essential techniques of capacity planning and load testing, providing you with actionable insights to ensure your infrastructure is optimized and resilient. What is Capacity Planning? Definition and Importance Capacity planning is the process of determining the necessary resources (like hardware, software, and network capacity) to meet future demands without over-provisioning. This involves forecasting system usage patterns based on past data, business growth projections, and anticipated workloads. The goal is to ensure that your infrastructure can scale up (or down) to meet demand efficiently without excessive resource allocation. Effective capacity planning helps avoid system bottlenecks, performance degradation, and resource wastage. It ensures that an organization’s infrastructure remains responsive and efficient under varying workloads. Key Factors to Consider: User Growth: Anticipate how user growth will impact your systems. Traffic Patterns: Account for seasonal or event-based traffic surges. Application Demand: Understand the resource needs of your applications (e.g., CPU, memory, bandwidth). Hardware and Software Limitations: Consider the maximum capacity limits of your current resources. The Role of Load Testing What is Load Testing? Load testing is a type of performance testing that evaluates how a system behaves under normal and peak conditions. The goal is to assess how well the system performs under varying levels of load, ensuring that it can handle the expected number of concurrent users or requests without issues. Unlike stress testing, which focuses on the system’s breaking point, load testing seeks to identify the system’s optimal capacity before performance starts to degrade. Importance of Load Testing: Identifying Bottlenecks: Load testing helps uncover bottlenecks that may not be visible during normal operation. Improving System Performance: By simulating real-world traffic patterns, load testing allows you to make data-driven improvements. Ensuring Reliability: Ensuring that systems can handle peak traffic without crashes or performance dips is critical for a smooth user experience. Key Techniques for Capacity Planning 1. Forecasting Demand with Historical Data One of the most effective methods of capacity planning is to analyze historical data from system usage patterns. By looking at trends in user activity, transaction volume, and resource consumption, businesses can forecast future demand more accurately. Actionable Tip: Use monitoring tools like Prometheus, Datadog, and New Relic to collect data over time and spot any usage patterns that can inform future planning. 2. Scalability Considerations It is essential to consider how your infrastructure can scale to meet future demands. This can include vertical scaling (adding more resources to a single machine) or horizontal scaling (adding more machines to distribute the load). Cloud-based environments, such as Amazon Web Services (AWS) and Microsoft Azure, make it easier to scale up and down as needed. Actionable Tip: Consider adopting a microservices architecture that allows for more granular scaling of different application components. 3. Utilizing Cloud Resources Cloud computing provides flexibility by allowing businesses to add or remove resources dynamically based on current demand. Auto-scaling can help businesses adjust their resources automatically to meet varying traffic levels, avoiding over-provisioning. Actionable Tip: Leverage cloud-based load balancers to distribute incoming traffic evenly across multiple servers, ensuring that no single resource is overwhelmed. 4. Service-Level Agreements (SLAs) When planning capacity, it’s important to set realistic performance goals through Service-Level Agreements (SLAs). SLAs help establish clear expectations for system performance and uptime, enabling you to plan for the necessary resources to meet these goals. Actionable Tip: Ensure that SLAs are aligned with business needs. If your SLA commits to 99.9% uptime, ensure that capacity planning accounts for any potential spikes in demand that might affect performance. Load Testing Best Practices 1. Define Testing Scenarios and Objectives Before conducting load testing, define clear scenarios and objectives. Testing should reflect real-world traffic patterns, including peak traffic volumes, spikes during promotions, or expected growth due to new features or marketing efforts. Consider how users interact with your application and simulate both normal and extreme user behaviors. Actionable Tip: Set goals for how many users your system should support without significant degradation in performance. For example, “The system should handle 10,000 concurrent users with a response time of less than 3 seconds.” 2. Use Appropriate Load Testing Tools There are several powerful tools available to simulate user load and analyze the system’s response: Apache JMeter: A popular open-source tool for load testing web applications. LoadRunner: A comprehensive tool by Micro Focus for testing and monitoring system performance under varying loads. Gatling: Another open-source tool designed for high-performance load testing, especially for web applications. Actionable Tip: Choose the tool based on your system’s needs, ease of use, and scalability requirements. 3. Gradually Increase the Load Start by simulating a small number of users and gradually increase the load to test how the system behaves under increasing stress. This allows you to identify the point where performance begins to degrade. Monitoring the system’s response to increasing load provides valuable insights into capacity limits and potential bottlenecks. Actionable Tip: Use a staged approach for load testing—start with low traffic, gradually ramp up to peak traffic, and measure how well the system handles the load at each stage. 4. Monitor System Performance During Load Tests During load testing, ensure you are continuously monitoring system performance, including response times, CPU usage, memory consumption, and error rates. This helps identify any resource constraints and helps in debugging potential issues. Actionable Tip: Use real-time monitoring tools like Grafana and Prometheus to track system health and automatically trigger alerts when the system performance is compromised during tests. 5. Conduct Performance Baseline Testing Establish a baseline performance measurement by running tests under normal conditions. This will help you understand the typical load your system can handle without issues. Regularly run these baseline tests to track improvements or regressions in performance as your

    This will close in 0 seconds