Top Agile Metrics Every Scrum Master Should Know
Introduction: The Power of Agile Metrics for Scrum Masters
As a Scrum Master, your role extends far beyond facilitating Scrum ceremonies and managing the team’s progress. To truly optimize team performance and drive continuous improvement, understanding and utilizing Agile metrics is essential. These metrics help you track progress, identify bottlenecks, and make data-driven decisions that lead to better results.
In this blog, we will explore the top Agile metrics every Scrum Master should know. We’ll also discuss how to use these metrics effectively to enhance your Scrum team’s productivity and deliver high-quality products.
1: Why Agile Metrics Matter for Scrum Masters
Data-Driven Decision Making
Agile metrics offer valuable insights that help Scrum Masters make informed decisions. Instead of relying on gut feeling or assumptions, data allows for evidence-based action, whether you’re addressing team performance, scope creep, or stakeholder expectations.
Continuous Improvement
The Agile mindset focuses on continuous improvement. By regularly tracking key metrics, you can identify areas for improvement, streamline processes, and optimize workflows, leading to better overall performance over time.
Transparency and Alignment
Agile metrics help ensure that both the Scrum team and stakeholders are aligned. These metrics provide transparency into the progress and health of the project, ensuring that everyone is on the same page.
2: Top Agile Metrics Every Scrum Master Should Know
1. Velocity
What is Velocity?
Velocity is one of the most commonly used metrics in Agile. It tracks the amount of work a Scrum team completes during a sprint, typically measured in story points or hours. This metric helps predict how much work the team can take on in future sprints.
Why it’s Important:
- Helps the team understand their capacity and plan accordingly.
- Provides insight into how well the team is performing over time.
- Helps with forecasting and setting realistic sprint goals.
How to Use It:
- Track the velocity over multiple sprints to identify trends and determine if the team is improving.
- Use the average velocity from previous sprints to forecast the team’s workload in future sprints.
Actionable Takeaway: If your team’s velocity drops significantly, review the past sprints for any obstacles or changes that may have affected performance.
2. Sprint Burndown Chart
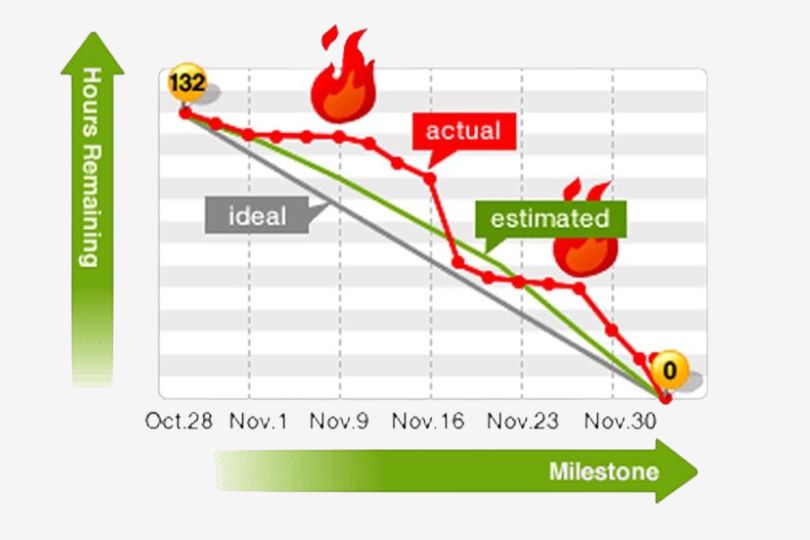
What is a Sprint Burndown Chart?
A Sprint Burndown Chart tracks the amount of work remaining in the sprint and provides a visual representation of the team’s progress toward completing the sprint goals. It plots the remaining work versus time, showing how much effort is left on a daily basis.
Why it’s Important:
- Provides a clear, real-time picture of the sprint’s progress.
- Helps identify any issues early, such as if the team is behind schedule.
- Improves transparency and helps with daily Scrum discussions.
How to Use It:
- Analyze the burndown chart daily to check if the team is on track.
- If the burndown chart shows a flat or rising trend, it could indicate a bottleneck or unplanned work that is preventing progress.
Actionable Takeaway: Use the Sprint Burndown Chart to motivate your team and keep them focused on the sprint goals. Address issues as soon as they arise to keep the team on track.
3. Cumulative Flow Diagram (CFD)
What is a Cumulative Flow Diagram?
A Cumulative Flow Diagram (CFD) shows the status of work items over time. It tracks how many items are in different workflow states, such as “To Do,” “In Progress,” and “Done.” The chart allows you to visualize how work moves through the system and where bottlenecks may occur.
Why it’s Important:
- Helps you identify bottlenecks or areas where work is getting stuck.
- Provides insights into whether the team is focusing on finishing work or starting too many tasks simultaneously.
- Allows you to track the flow of work over time and make adjustments to the process as needed.
How to Use It:
- Monitor the flow of work to ensure there is a balance between each stage.
- If the chart shows an accumulation of work in one stage, focus on removing bottlenecks by adjusting the process or reallocating resources.
Actionable Takeaway: Use the CFD to monitor the efficiency of your team’s workflow and make necessary adjustments to eliminate bottlenecks.
4. Lead Time and Cycle Time
What are Lead Time and Cycle Time?
Lead Time: The total time from when a request is made (e.g., a user story is added to the backlog) until it’s completed.
Cycle Time: The time it takes to complete a task once the work begins.
Why it’s Important:
- These metrics help you understand how long it takes to deliver value to stakeholders or end-users.
- Helps identify delays and inefficiencies in the process.
- Cycle time can help you understand how quickly the team responds to requests, while lead time focuses on the overall delivery.
How to Use It:
- Track lead and cycle time over multiple sprints to identify areas where delays may occur.
- Aim to reduce both lead time and cycle time through continuous process improvements.
Actionable Takeaway: Focus on reducing cycle time by ensuring that work flows smoothly through the process, and review lead time to eliminate delays in the approval or initiation phases.
5. Work in Progress (WIP)
What is Work in Progress (WIP)?
Work in Progress (WIP) refers to the number of work items that are currently being worked on but have not yet been completed. Limiting WIP is a key principle in Agile, as it helps teams focus on finishing work before taking on new tasks.
Why it’s Important:
- Helps teams avoid spreading themselves too thin and ensures they can focus on completing work.
- Reduces multitasking and improves team efficiency.
- Prevents bottlenecks by limiting the amount of work in any given workflow stage.
How to Use It:
- Set WIP limits for each stage of the workflow to prevent overloading team members.
- Monitor WIP to ensure that the team is not taking on too much work at once, which can lead to decreased productivity.
Actionable Takeaway: Implement WIP limits to maintain focus on completing work and improving the overall flow of tasks within the sprint.
3: How to Use Agile Metrics Effectively
Create a Balanced Metric Dashboard
While individual metrics provide valuable insights, tracking them in isolation may not give you the complete picture. Create a balanced dashboard that combines multiple metrics to track team performance, identify improvement areas, and predict future outcomes.
Use Metrics for Continuous Improvement
The key to using Agile metrics effectively is to apply them to the continuous improvement process. Regularly review your team’s metrics and use them to guide retrospectives, identify bottlenecks, and adjust workflows.
Don’t Overload the Team with Metrics
Focusing on too many metrics can lead to analysis paralysis. Choose the most relevant and impactful metrics for your team and focus on improving those areas. As your team matures, you can introduce additional metrics to help refine your processes further.
Conclusion: Agile Metrics as Tools for Success
Agile metrics are powerful tools that Scrum Masters can leverage to improve team performance, optimize workflows, and ensure the successful delivery of products. By tracking key metrics such as velocity, burndown charts, lead time, and WIP, Scrum Masters can make informed decisions that enhance team efficiency and stakeholder satisfaction.
Ready to take your Scrum team’s performance to the next level? Start tracking these Agile metrics today and optimize your team’s success. Subscribe for more insights on Scrum practices and Agile techniques!